
How Do You Troubleshoot a Kubernetes Pod That Is Not Starting?
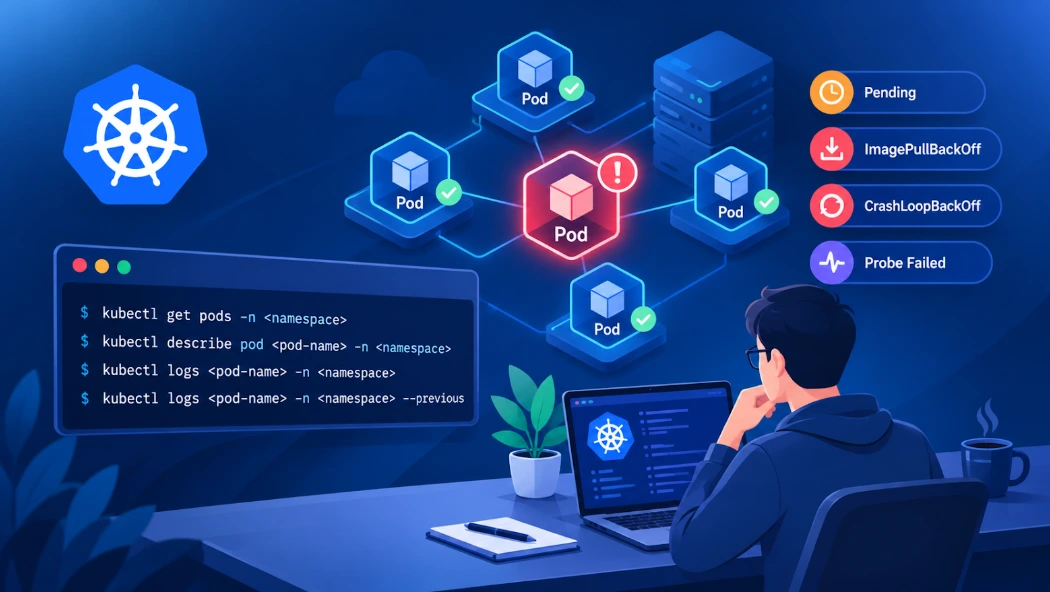
A Pod that won't start is one of those problems every Kubernetes engineer runs into sooner or later, usually right before a deploy needs to go out. The trick to fixing it fast isn't guessing at the cause. It's following the evidence: check the Pod's status, read its events, then work through logs, config, and resources in order.
This guide walks through a repeatable Kubernetes Pod Troubleshooting process for the errors you'll see most: Pending, ImagePullBackOff, CrashLoopBackOff, and failed probes. If you just want the short version: run kubectl get pods, then kubectl describe pod, then check the logs. The Events section almost always tells you whether the problem is scheduling, image pulls, storage, or the container crashing on its own.
Table of Contents
▼What "Not Starting" Actually Means
Kubernetes tracks a Pod's phase separately from its container states, and the two don't always tell the same story. A Pod can be marked as scheduled but still fail because the image can't be pulled. Or it can start, crash a few seconds later, and get stuck in a restart loop that never resolves.
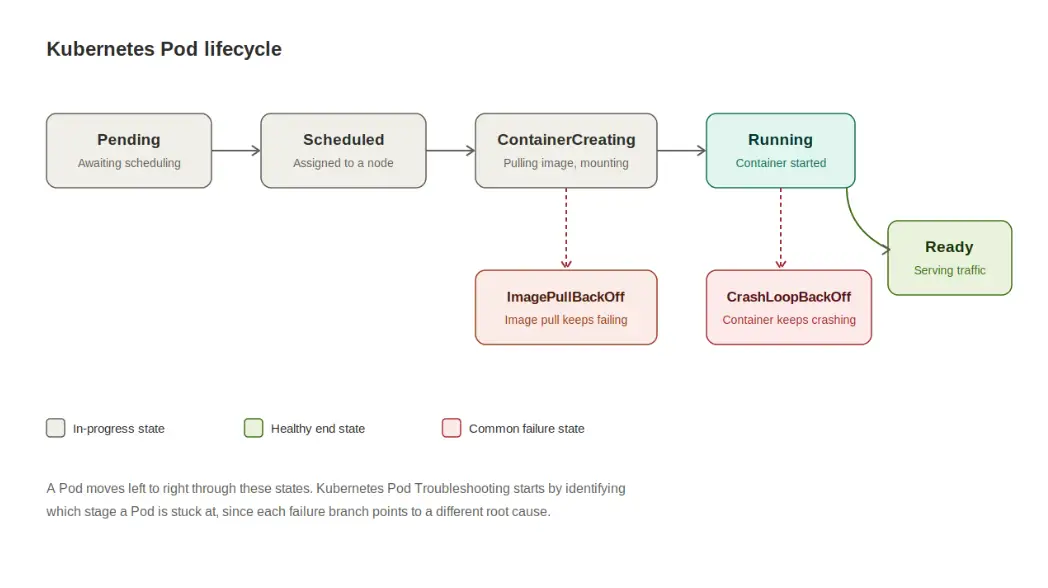
| Status | What it usually means | Where to look first |
|---|---|---|
| Pending | Can't be scheduled or a startup dependency is missing | Events, node capacity, PVCs |
| ImagePullBackOff | Image download keeps failing | Image name/tag, registry secrets |
| CrashLoopBackOff | Container starts, exits, restarts, repeats | Previous logs, exit code, probes |
| CreateContainerConfigError | Bad or missing config | ConfigMaps, Secrets, env vars |
| OOMKilled | Container hit its memory limit | Resource limits, app memory usage |
| Running, 0/1 Ready | Container's up but failing readiness checks | Readiness probe, app health endpoint |

First Commands to Run
Start here, every time, before you jump to a theory about what's wrong:
kubectl get pods -n <namespace>
kubectl describe pod <pod-name> -n <namespace>
kubectl logs <pod-name> -n <namespace>
kubectl logs <pod-name> -n <namespace> --previous
kubectl describe pod does most of the heavy lifting here. It shows you scheduling decisions, image pull errors, mount failures, and recent events in one place, which is exactly why the Kubernetes docs point to it as the first debugging step.
If the container is crashing fast, current logs might be blank. That's what --previous is for — it pulls logs from the last terminated instance instead of the one that just started.
For an incident, grab a fuller snapshot in one go:
kubectl describe pod <pod-name> -n <namespace>
kubectl logs <pod-name> -n <namespace> --all-containers=true --tail=200
kubectl get events -n <namespace> --field-selector involvedObject.name=<pod-name> --sort-by='.lastTimestamp'
You're trying to answer four things: Did it get scheduled? Did the image pull succeed? Did the container start and then stop? Was something else — a probe, a volume, a resource limit — blocking it?
If you're prepping for a Kubernetes-focused interview, knowing this workflow cold is worth the effort — see MicroDegree's Kubernetes interview questions for experienced engineers for the kind of troubleshooting scenarios that come up most often.
Fixing Pods Stuck in Pending
Pending almost always means the scheduler couldn't place the Pod, or it's waiting on something like storage. Check the event text:
0/3 nodes are available: 3 Insufficient cpu.
0/3 nodes are available: 2 node(s) had untolerated taint.
That tells you exactly why. Then compare requests against what's actually available:
kubectl get nodes
kubectl top nodes
kubectl get pvc -n <namespace>
kubectl top nodes (and kubectl top pods) only works if Metrics Server is installed and running in the cluster. If it isn't, these commands fail with an error like metrics not available yet or Metrics API not available, rather than showing zero usage — so don't mistake that error for "everything's fine." Most managed Kubernetes services (EKS, AKS, GKE) install Metrics Server by default, but self-managed clusters often need it added separately.
| Cause | How you'll see it | Fix |
|---|---|---|
| Not enough CPU or memory | FailedScheduling event | Right-size requests or scale the node pool |
| Untolerated taint | Event mentions taint | Add the toleration, if appropriate |
| Node selector mismatch | Affinity/selector event | Fix labels or loosen the rule |
| Unbound PVC | kubectl get pvc shows Pending | Fix the StorageClass or PV |
| ResourceQuota limit | Namespace quota output | Adjust the quota |
Fixing ImagePullBackOff
This one means Kubernetes keeps failing to download the image and is backing off between retries. Run kubectl describe pod and read the actual error text — it's more useful than the label itself:
manifest for registry.example.com/team/api:v2 not foundor
unauthorized: authentication requiredThe first is a bad tag or typo. The second is a credentials problem. These same error patterns show up consistently whether you're running a managed service like EKS, AKS, or GKE, or a self-managed cluster — the underlying container runtime reports the failure the same way regardless of who manages the control plane.
Check the exact image reference:
kubectl get pod <pod-name> -n <namespace> -o jsonpath='{.spec.containers[*].image}'Watch for case-sensitive repo names and tags that no longer exist. Avoid deploying with latest — it's mutable, so the same manifest can pull a different image tomorrow. Use a versioned tag or digest instead.
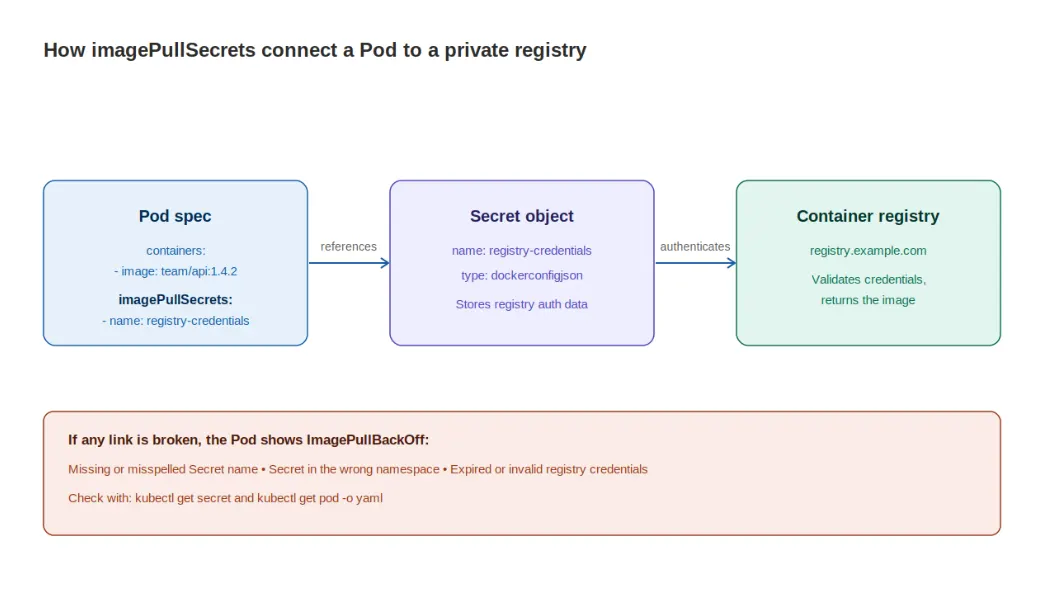
For private registries, confirm the pull secret exists and is actually referenced:
spec:
  imagePullSecrets:
    - name: registry-credentials
Never hardcode registry passwords in a Deployment. Use a Secret or your cloud provider's workload identity.
Fixing CrashLoopBackOff
CrashLoopBackOff isn't the actual problem — it's Kubernetes telling you the container keeps dying and it's spacing out the restarts. The real cause is somewhere in the logs, the exit code, or the config.
Start with the previous instance's logs:
kubectl logs <pod-name> -n <namespace> --previousCommon culprits: a missing environment variable, a bad database connection string, a config file that isn't where the app expects it, or a port collision. Then check the exit code under kubectl describe pod:
| Exit code | Likely cause |
|---|---|
| 0 | Process finished normally but shouldn't have exited |
| 1 | App-level startup or config failure |
| 137 | SIGKILL after an OOM kill — check memory limits and actual usage |
| 127 | Command or binary not found in the image |
These exit codes reflect how the kubelet and container runtime report termination, so the same table applies regardless of which runtime (containerd, CRI-O) sits underneath. 137 in particular is a reliable signal to check OOMKilled in the container's Last State before looking anywhere else.
Example: an app expects DATABASE_URL from a Secret key that was renamed during a refactor. The Pod crashes on boot with an unhandled exception, restarts, crashes again. kubectl describe pod shows the missing key in Events; kubectl get secret -o yaml confirms it. Fixing the key reference resolves it in one deploy.
Getting comfortable with failures like this on a real production cluster, not just a local sandbox, is a big part of what separates a working knowledge of Kubernetes from job-readiness. MicroDegree's guide on Kubernetes in production best practices covers the broader operational habits — resource limits, config management, rollout strategy — that prevent a lot of these crashes before they happen.
Health Probe Failures
Probes decide whether a container gets restarted or pulled from traffic. Mixing them up wastes time.
- Liveness probe — is the process still healthy? Failure restarts the container.
- Readiness probe — can it take traffic right now? Failure just pulls it from the Service.
- Startup probe — has it finished booting? Protects slow-starting apps from being killed too early.

If events show Liveness probe failed right before a CrashLoopBackOff, your app is probably just slow to start, and Kubernetes is killing it before it's ready. A startup probe with a generous failureThreshold usually fixes this without touching application code.
If you need to poke around inside a running Pod without changing its image, kubectl debug is the standard way to do it — it's a stable, GA feature at this point, not something experimental. It attaches an ephemeral debug container to a running Pod (or clones the Pod with extra tooling), so you can run shells, network utilities, or diagnostic binaries that were never part of your production image.
kubectl debug -it <pod-name> -n <namespace> --image=busybox --target=<container-name>This is especially useful for distroless or minimal images that don't ship a shell at all.
Troubleshooting Init Container Failures
Init containers run before your main application container starts, and they have to finish successfully before Kubernetes moves on. When a Pod is stuck with a status like Init:0/2 or Init:CrashLoopBackOff, the problem isn't in your main container at all — it's in one of the init steps.
Start by checking which init container is failing:
kubectl get pod <pod-name> -n <namespace>The STATUS column shows something like Init:1/2, meaning the first init container succeeded and the second is still running or has failed. Then pull logs from that specific container:
kubectl logs <pod-name> -n <namespace> -c <init-container-name>Common init container failures include:
| Cause | Symptom | Fix |
|---|---|---|
| Waiting on a dependency that never becomes ready | Init container hangs, never completes | Check the dependency's own status and logs |
| Bad script or command | Init container exits with a non-zero code | Review the exact command and its exit code |
| Missing volume or permissions | Init container fails on file access | Check volume mounts and security context |
| Network policy blocking the init step | Connection timeout in logs | Review NetworkPolicy rules for the namespace |
Init containers run in order, one at a time, and a failure in any one of them blocks the whole Pod from starting its main containers. If a Pod seems stuck before you even get to CrashLoopBackOff on the application itself, checking init container status first will usually save you from debugging the wrong container entirely.
This kind of debugging depth is exactly what employers expect from Kubernetes-skilled engineers going into 2026. If you're mapping out what to learn next, MicroDegree's Kubernetes roadmap for working professionals in 2026 lays out a sequence that goes from these fundamentals through to production-grade skills.
Conclusion and FAQs
Conclusion
Fixing a Pod that won't start comes down to following the evidence in order: status, events, logs, then config and resources. Once you know what each failure state — Pending, ImagePullBackOff, CrashLoopBackOff — actually points to, and you know to check init containers separately from the main application, you stop guessing and start diagnosing. That's the difference between a five-minute fix and a stalled deployment.
FAQs
1. How do you troubleshoot a Kubernetes Pod that is not starting?▼
Run kubectl get pods, then kubectl describe pod, then check logs. The Events section usually reveals whether it's a scheduling, image, config, or crash issue.
2. How do I fix CrashLoopBackOff?▼
Check kubectl logs --previous, the exit code, and the app's config, Secrets, and probes. The label just means the container keeps failing to start.
3. What causes ImagePullBackOff?▼
A wrong image name or tag, missing registry credentials, or an image that no longer exists in the registry. These patterns are consistent across managed clusters like EKS, AKS, and GKE, as well as self-managed clusters.
4. Why is my Pod stuck in Pending?▼
Usually insufficient node resources, an untolerated taint, or an unbound PVC. Check the FailedScheduling event for the specific reason.
5. Why does kubectl top nodes or kubectl top pods fail?▼
It depends on Metrics Server being installed and healthy in the cluster. If it's missing or unhealthy, the command returns an error rather than usage data.
6. Why is my Pod stuck at Init status?▼
One of its init containers hasn't completed successfully yet. Check kubectl get pod for the exact init step, then pull that container's logs with kubectl logs -c <init-container-name>.
7. Can I debug a Pod without rebuilding its image?▼
Yes. kubectl debug is a stable, standard tool for this. It attaches an ephemeral debug container to a running Pod so you can run shells or diagnostic tools that aren't in the production image.
If you want hands-on practice diagnosing these failures on real clusters instead of just reading about them, MicroDegree's Kubernetes and DevOps learning paths are built around exactly this kind of troubleshooting work.