
What Is Observability in DevOps? Logs, Metrics, Traces & OpenTelemetry Explained
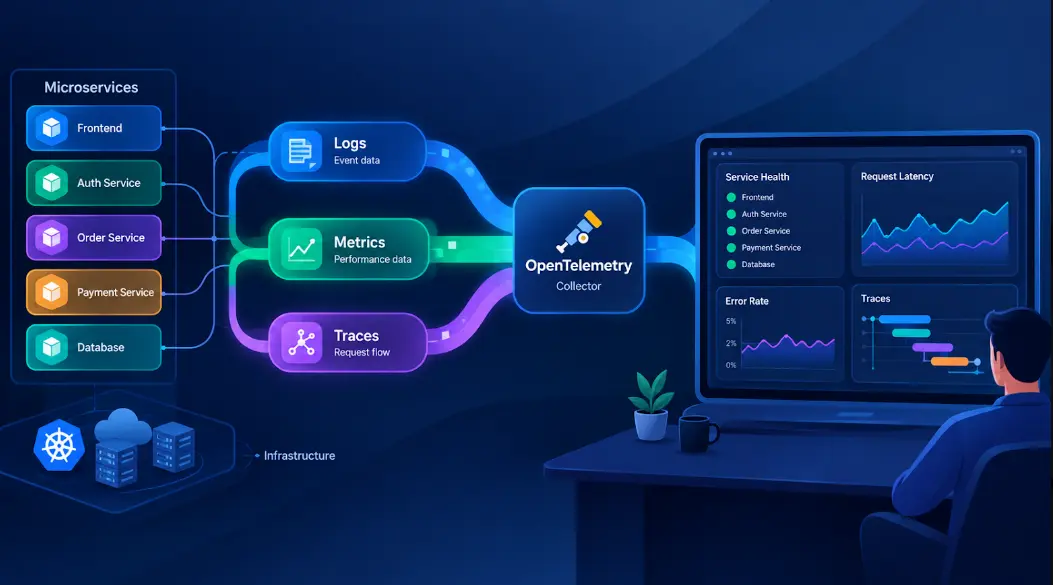
Checkout is slow. Support tickets are piling up. You open Grafana and everything is green, which is almost worse than a red screen, because now you have no idea where to start. Teams hit this wall all the time, and it's the problem DevOps observability exists to solve.
Below: what observability actually means, how logs, metrics and traces differ, where monitoring stops being enough, and why most teams now collect all of it through OpenTelemetry. There's a rollout plan near the end too.
Table of Contents
▼What Is DevOps Observability?
Observability is how well you can understand what a system is doing on the inside, using only what it sends out. In practice that means you can chase down a weird, never-seen-before bug using the data you already collect, without adding a log line, redeploying and waiting for it to happen again.
Why does that matter so much now? Because one user click rarely hits one machine anymore. It might touch an API gateway, an auth service, a cache, two databases and somebody else's payment API. Any of those can be the slow one. Worse, the problem may only appear for one request in five hundred, so you can't just reproduce it locally and poke around.
So the questions get specific. Which service is dragging? Why did this one order fail? What changed ten minutes before errors jumped?

The Three Pillars: Logs, Metrics and Traces
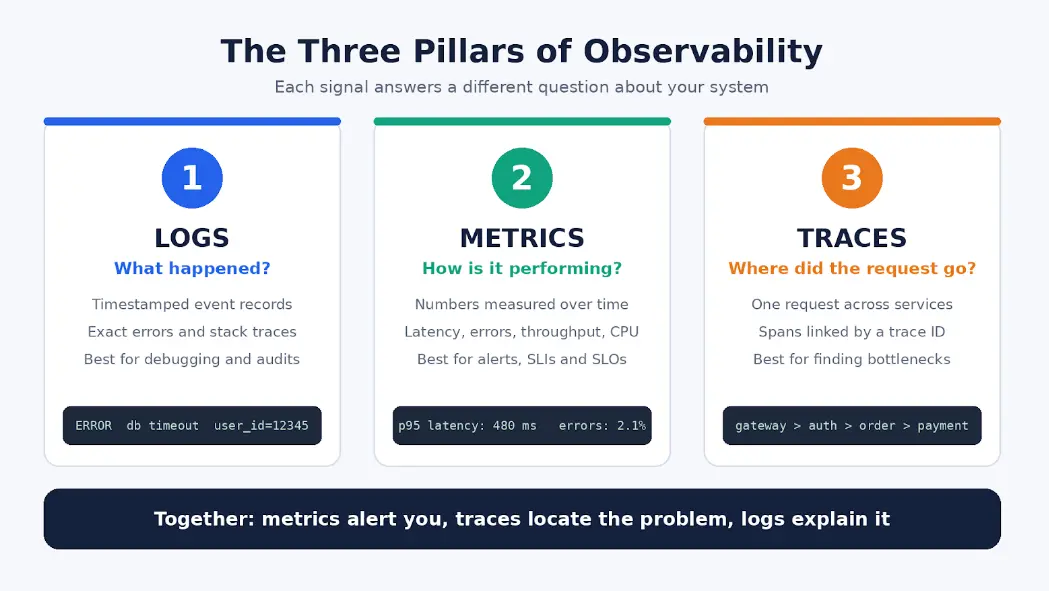
You'll hear these called the three pillars. Each one answers a different question, and each has a blind spot the others cover.
Logs
A log is a line of text saying something happened, with a timestamp. "ERROR database connection timeout for user_id=12345" is a log. They're the most detailed signal you have, which is why you reach for them when you need the exact error, the stack trace or the order of events before a crash.
They're also the messiest. Volume grows quickly, storage bills follow, and free-form text across forty services is miserable to search. Structured JSON logs with a trace ID in every line fix most of that.
Metrics
Metrics are numbers over time. Latency at p95 and p99, error rate, requests per second, CPU, memory, queue depth. They're small, cheap and fast to query, so they power your dashboards, your alerts and your SLOs.
But a metric can't explain itself. It will happily tell you p95 latency doubled at 14:10 and say nothing about why.
Traces
A trace follows a single request from the moment it enters your system until it leaves. Every hop is a span with a start, an end and a few attributes, all stitched together by one trace ID.
Say a checkout takes 400ms. The trace shows the gateway used 15ms, auth 8ms, the order service 45ms, the payment service 320ms, and the email service 12ms. No arguing about whose fault it is. Payment. The catch is that every service has to pass the trace context along. If one skips it, the trace breaks into pieces.
How they fit
A metric alert fires. You open a trace to see which service is failing. Then you read that service's logs for the stack trace. Drop any step and you end up guessing.
Monitoring vs Observability
They get used interchangeably, and that causes real confusion.
Monitoring is checking things you decided in advance. Is the service up? Is CPU above 80%? Are errors over 5%? It's good at known failures and not much else.
Observability covers the failures you didn't predict. Nobody writes an alert for a problem they've never imagined, so you need data detailed and connected enough to explore on the fly.
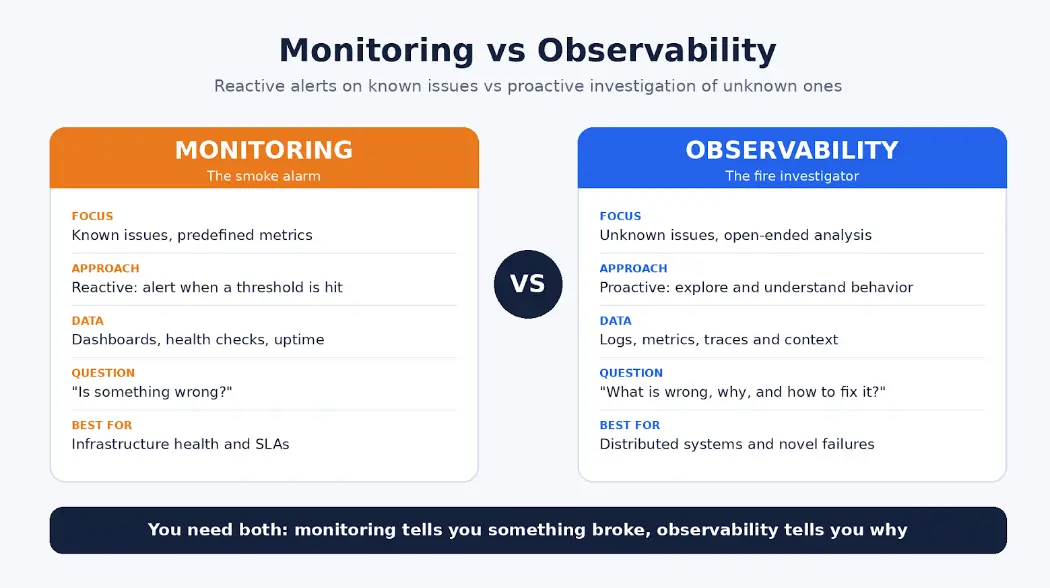
Do you pick one? No. Think smoke alarm and fire investigator. The alarm tells you something's burning. The investigator works out where it started. With only the alarm you're left staring at smoke, and with only the investigator you learn about the fire from your customers.
What Is OpenTelemetry and Why Does It Matter?
OpenTelemetry (OTel for short) is an open-source, vendor-neutral standard for producing and shipping telemetry. It lives under the CNCF and has pretty much won the instrumentation argument.
The old way was painful. Pick Datadog, and you instrument with Datadog's SDK. Decide a year later to move to New Relic or Splunk, and you're editing code in every service. OTel flips that. You instrument once and decide later where the data goes.
The moving parts:
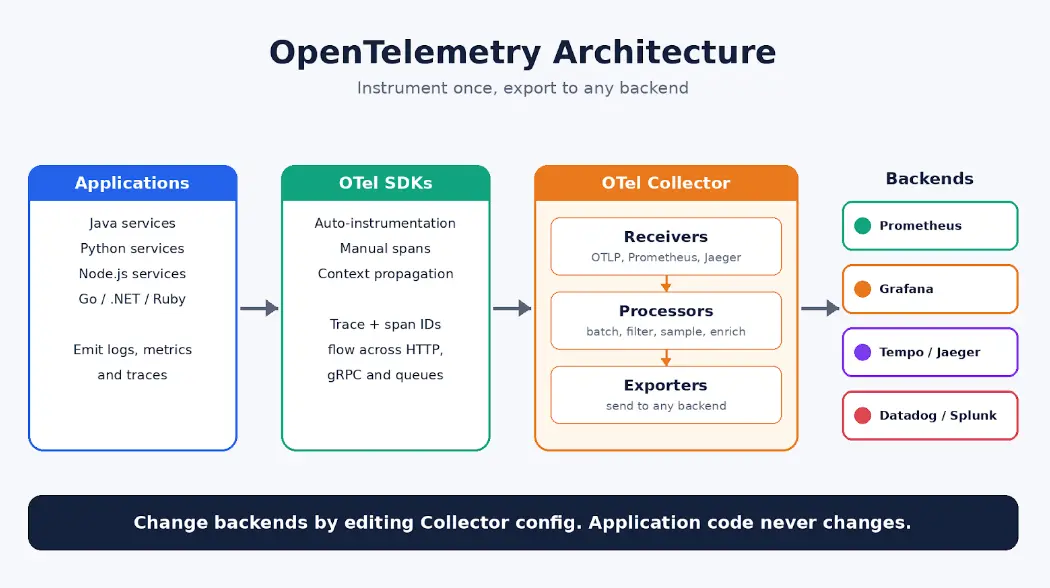
- APIs and SDKs for Java, Python, Go, Node.js, .NET, Ruby, PHP and others, handling traces, metrics and logs. Log support is generally available in the spec and major SDKs, but maturity and backend integration still vary by language and vendor, so check the OTel docs for your stack.
- Auto-instrumentation, which gets you data with little or no code. On Java you attach an agent to the JVM. On Python and Node.js you install packages for the frameworks you use.
- The Collector, a separate service that receives telemetry, batches, filters, samples and enriches it, then exports to Prometheus, Grafana, Datadog or whatever you run.
- Context propagation, which carries trace and span IDs over HTTP, gRPC and message queues so traces stay connected.
The Collector is the clever bit. Changing backends becomes a config edit, and your application code stays untouched.
How It Fits Into a DevOps Stack
A typical setup looks like this: services emit data through OTel, the Collector processes it, a backend stores it. Prometheus commonly holds metrics, Loki or Elasticsearch holds logs, Tempo or Jaeger holds traces, and Grafana or Kibana sits on top.
It doesn't stop at runtime. In CI/CD, tag telemetry with the release version and you can see within minutes whether a deploy made things worse. Some teams wire that into automatic rollbacks when an SLO breaks. On Kubernetes, the Collector usually runs as a DaemonSet or a sidecar. Bigger setups often go two-tier: an agent DaemonSet on every node, plus a central cluster deployment that does the heavy processing and exporting. On AWS or Azure, you can send OTel data to the tools you already have (CloudWatch, X-Ray, Azure Monitor) or to independent backends like Prometheus and Grafana, so OTel complements those services rather than replacing them.
SRE practice leans on this data heavily. SLIs like latency and error rate, SLOs such as 99.9% availability, error budgets and blameless postmortems are only as good as the telemetry beneath them.
How to Implement DevOps Observability
Don't try to instrument everything in one go. That's how these projects stall. Try this order instead.
- Pick a goal. Shorter MTTR? Clearer dependencies? SLO tracking? Your answer decides what to instrument first.
- Choose one critical path. Checkout, signup, payment, whichever journey costs you the most when it breaks. Instrument only those services.
- Add OTel. Switch on auto-instrumentation, then add manual spans where you need detail. Give spans real names ("POST /api/orders" beats "HTTP request"), attach attributes like order ID or region, and flag errors clearly.
- Deploy the Collector. Sidecars isolate nicely, a DaemonSet costs less per node, and a standalone deployment is simplest for small setups. Set up receivers, processors for batching and sampling, and your exporters.
- Build a few dashboards and alerts. Start with service health, a dependency map and resource use. Alert on SLO breaches, p99 spikes and throughput drops, and make sure each alert tells the on-call person what to do next.
- Build the habit. Open traces during incidents. Add instrumentation while writing features, not after. Keep runbooks that link to actual queries.
Real-World Use Cases
- Random latency spikes. Average latency looks fine, yet users complain. Check p99, filter traces above your threshold, find what the slow ones have in common, and read their logs. Often it's a single database query or one flaky external API.
- Cascading failures. One service dies and five more start throwing errors. A dependency map and a failing trace show where it started. Metrics tell you if traffic or resource exhaustion was involved. After that you add timeouts and circuit breakers so it can't spread again.
- Checking a deploy. Tag everything with a version or commit SHA, compare before and after, filter traces by version. If the new build is guilty, roll back and watch the numbers recover.
- Trimming cloud bills. Traces reveal chatty, slow calls. Metrics reveal services running far below their allocation. You right-size from evidence, not hunches.
Conclusion
Once a system is distributed, observability stops being a nice extra. Logs tell you what happened, metrics tell you how things are trending, traces tell you where a request went, and OpenTelemetry lets you collect all three without tying yourself to one vendor. Start small. One critical path, a handful of dashboards, then grow.
If you'd like hands-on practice, MicroDegree's DevOps and Cloud Computing programs are built for working IT professionals. Browse the courses, read more on Kubernetes, Terraform and Platform Engineering, or join the community to compare notes on real incidents.
FAQs
1. What is DevOps observability?▼
It's the ability to understand a system's internal state from the data it produces, mainly logs, metrics and traces. Teams use it to diagnose problems in distributed environments faster than monitoring alone allows.
2. How is observability different from monitoring?▼
Monitoring alerts you when predefined thresholds are crossed. Observability lets you investigate unknown problems and ask new questions without adding new instrumentation.
3. What are the three pillars of observability?▼
Logs record events, metrics measure performance over time, and traces follow a request across services. Together they give a complete picture.
4. Why use OpenTelemetry?▼
It's open source and vendor-neutral, so you instrument once and export to any backend. That removes lock-in and keeps your setup flexible.
5. Can observability reduce cloud costs?▼
Yes. Traces and metrics expose slow or redundant calls and over-provisioned resources, so you can optimize using data instead of guesses.